We’re excited to announce Health Scan Express v1.1, bringing powerful new visualization features to help you understand your health data at a glance.
What’s New
30-Day Trend Charts
The biggest addition in this update is charts for both Blood Pressure and Weight readings. Now you can:
- Visualize trends over the last 30 days with clear, easy-to-read graphs
- Track systolic and diastolic blood pressure separately with color-coded lines
- Monitor weight changes and see your progress with highlighted areas showing your range
- Spot patterns in your readings to better understand your health
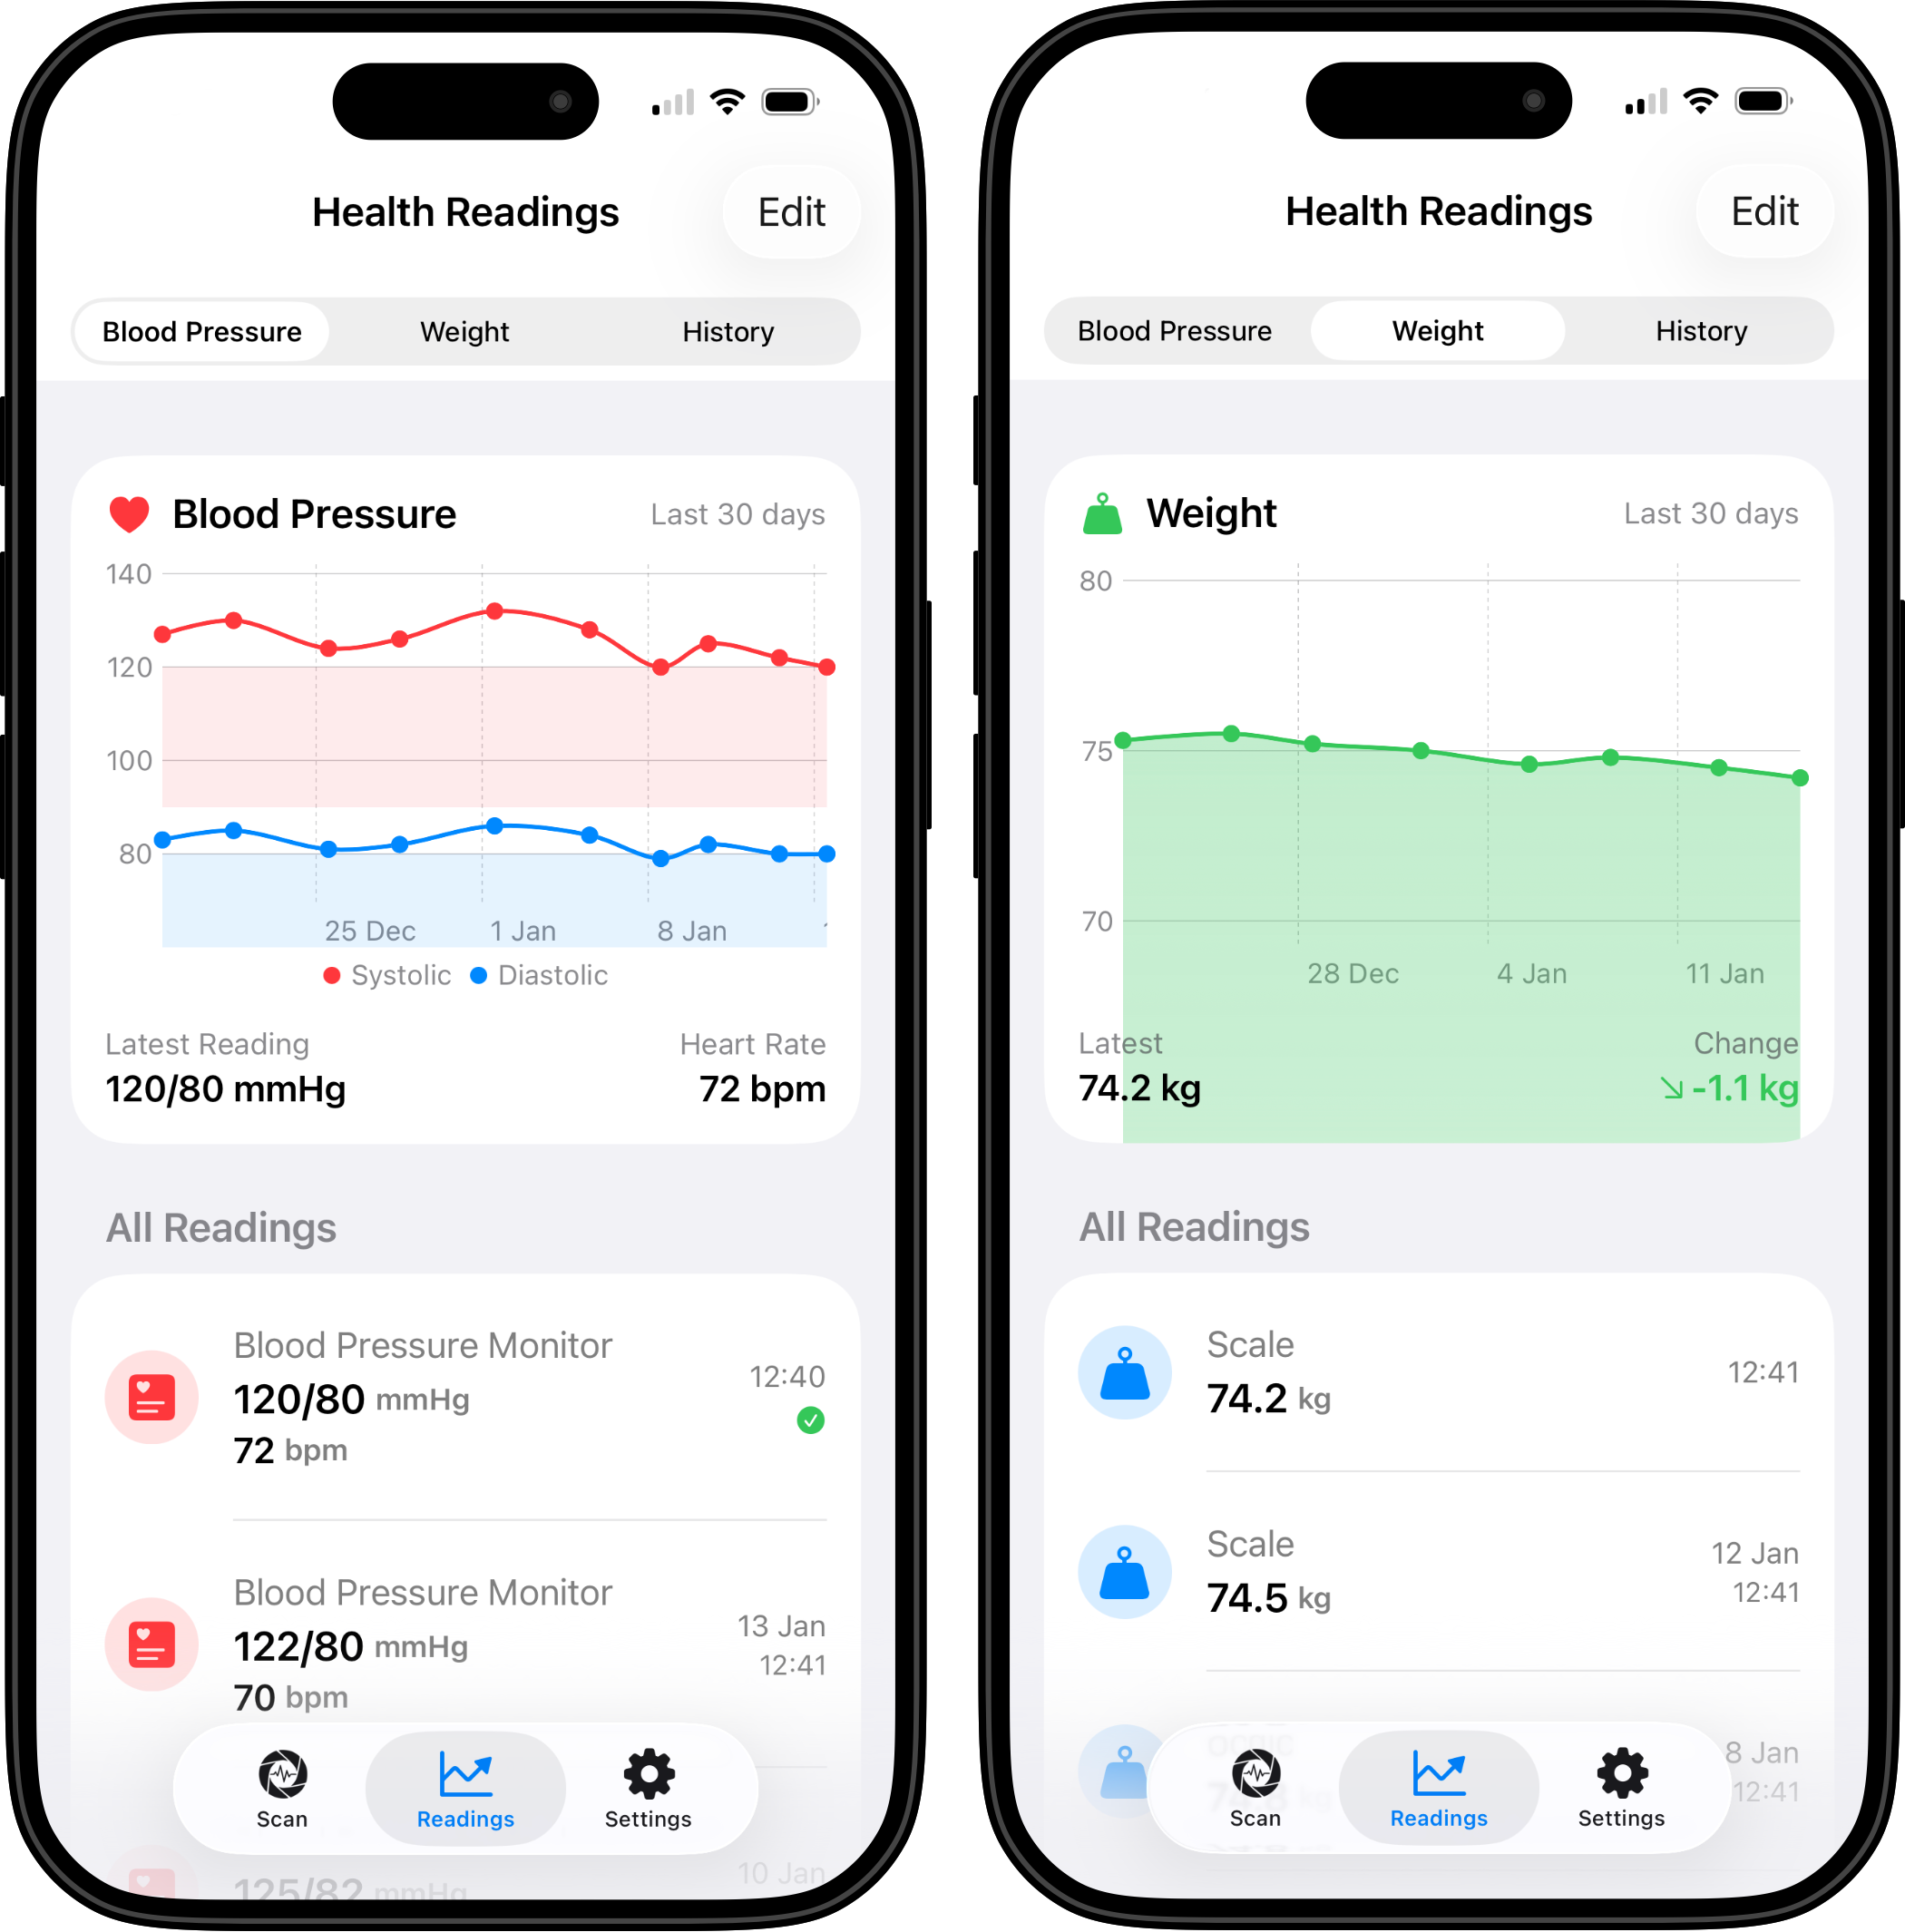
The Blood Pressure chart displays your systolic (red) and diastolic (blue) readings with a shaded healthy range zone, making it easy to see when your readings are in the optimal range. Your latest reading and heart rate are prominently displayed below the chart.
The Weight chart shows your measurements over time with a green area fill, along with your latest weight and the change from your previous reading.
Improved Scanning Experience
We’ve also made scanning your health devices more intuitive. When you’re capturing a reading, the scanning process is now more obvious with a blur effect that lets you know the app is working to recognize your measurement.
Why Charts Matter
Tracking individual readings is valuable, but seeing trends over time is where the real insights happen. With these new charts, you can:
- Notice if your blood pressure is trending up or down
- See the impact of lifestyle changes on your weight
- Share meaningful data with your healthcare provider
- Stay motivated by visualizing your progress
Update Now
Version 1.1 is available now on the App Store. Update your app to start tracking your health trends with beautiful, informative charts.